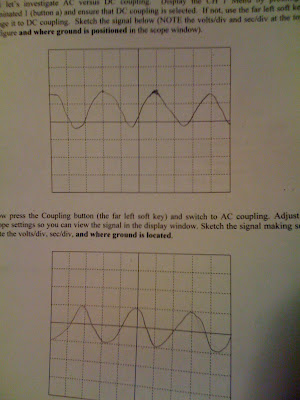
The peak-to-peak amplitude already been given which was 5V, so we got the period was 2*10^-3s. For the following calculation part we have the peak to peak value was 10V, zero to peak amplitude was 5V and the RMS was 5/square root of 2V. We switched the DC to AC and measured the voltage for the both part they were 5.1mV and 3.33V. VAS compare to the scope calulation: it should be equivalent to RMS. The graph that we draw for the next part, i showed at below image.
The offset for DC or AC coupled should be 2.5V offset. For the measuring part for VDC and VAC, we had a big different with other groups which we got VDC=2.56V and VAC=6.2V. Then, we press the square button which show the image like a great wall, we had the VDC still showed 2.5V, but the VAC changed to 7.6V.
For the two mystery part, i will show the data at two chart below:
Channel 1 Channel 2
DC voltage: 0.3 DC voltage: 0.8V
Frequency: 1KHZ Frequency: 6.06KHZ
Pk-Pk Amp: 0 .6V Pk-Pk Amp: 1.6V.
The concept of this lab which is really not a hard part, but it has a little unorganized.

