Friday, May 13, 2011

Laboratory #10 Oscilloscope 101

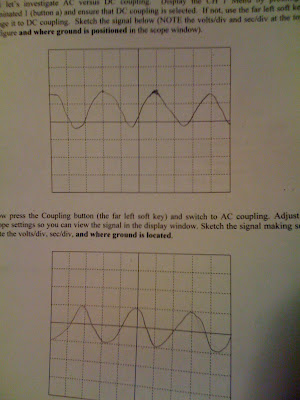
This lab basically used an electronic instrument which called oscilloscope measuring the voltage signal and show on the screen. It just like the picture below.
The peak-to-peak amplitude already been given which was 5V, so we got the period was 2*10^-3s. For the following calculation part we have the peak to peak value was 10V, zero to peak amplitude was 5V and the RMS was 5/square root of 2V. We switched the DC to AC and measured the voltage for the both part they were 5.1mV and 3.33V. VAS compare to the scope calulation: it should be equivalent to RMS. The graph that we draw for the next part, i showed at below image.
The offset for DC or AC coupled should be 2.5V offset. For the measuring part for VDC and VAC, we had a big different with other groups which we got VDC=2.56V and VAC=6.2V. Then, we press the square button which show the image like a great wall, we had the VDC still showed 2.5V, but the VAC changed to 7.6V.
For the two mystery part, i will show the data at two chart below:
Channel 1                                                      Channel 2
DC voltage: 0.3                                                 DC voltage: 0.8V
Frequency: 1KHZ                                             Frequency: 6.06KHZ
Pk-Pk Amp: 0 .6V                                            Pk-Pk Amp: 1.6V.
The concept of this lab which is really not a hard part, but it has a little unorganized. 

Friday, April 29, 2011

Laboratory #9 Operational Amplifiers 1

This was a long lab which we did for two days. It was basic using the amplifiers increase the small input voltage, and make it bigger when becomes the output.
Before we start the lab, we read the lab, so that we knew the op-amp that is actually consist of a lot of resistors, transistors and capacitors. According to the material, we could calculate the set up first. We got Ri(theoretical)=1K, and Rf(theoretical) for 10K. In addition, we used both power supply for 6V.  The Rx just equal to V^2/P=288, Is=V/Rx=.02A. The maximum setting for Ry which is just 1/0.02A=50ohms, but the actual we had is 51ohms. In order to know the Vth, we did figure out the current first, which is 6/288=0.1717A, so by using the KCl, -6+288*I=-Vth, so the Vth=2.9V. After all the calculations, we set up out circuit by using Ri=988ohms, Rf=9.87kohms, Rx=297 ohms, a the vary resistor,and V1=12.12V, V2=12.13V.

As the image set up, we measured out group of data the Vout=0.019V,-2.5,-5.07,-7.55,-9.94, so the gain that we had which are all around 10. Then we measured Vri=0.003V,0.25V,0.5V,0.75V,0.99V,so we could calculate the Iri=0.003mA, 0.253mA, 0.506mA, 0.759mA, 1.002mA. Also the Vrf that we got are 0.019V, 2.53V, 5.09V, 7.6V, 9.97V.
For the last part that we did in the lab was measuring the Iv 1 and Iv 2, that we got 0.6mA, and 0.99mA, and we thought out data was good.  For calculating the power for each one just P1=V1*I1=12.12*0.6mA=7.272mW and P2=V2I2=12.13*0.99mA=12.0087mW. 
After doing this lab, i feel more interesting because we actually did some stuff which change something. I am looking forward the second op-amp lab.

Monday, April 4, 2011

Laboratory #8 PSpice Thevenin and Max Power (Homework)

The homework that i did by using the PSpice tools which made the homework problem seems easier and more clear. Here is the plot image to show the thevenin below:
The number that i have is Vth =50V , the Rth =5 ohms
here is the second plot to show the max power:
The Vth45.38 , Rth= Vload=97.44 and Pload=5.28W.

Sunday, April 3, 2011

Laboratory #7 Pspice for Thevenin and Norton Equivalents


This lab could showed us more details on the voltage at each point by using schematics, and the range of the voltage by looking at the sweep map. Based on the tutorial, we got the following pictures.

The numbers that we got was exactly same from what we calculated in the class. It means this software works really well.  Then, we run the circuit to show the DC sweep image.
The second circuit was a little bit hard to draw and it need VSRC to find the probing current and voltage by using the DC sweep.
The Voltage image:
The current image:

The last part of this experiment was to find the maximum power.

Finally, we got the maximum power was 250μW,  inallAfter all, i felt the PSpice is a powerful tool, it could help us to figure the Vthevenin, norton current and even the maximum power. It also show us the image of the unknown question. It will save us a lot of time to do the homework.

Thursday, March 31, 2011

Laboratory #6 Thevenin Equivalents

This lab we did on this Monday that used thevenin method to make the complicated circuits look easier.
When the circuit have many sources and multiple loads, then we could calculate the thevenin to make the problem easier.


Before the lab began, we had the set up number for resistors and the voltage of the sources. They were Rc1= 100 ohms, Rc2=Rc3=39 ohms, RL1=680 ohms and Vs1=Vs2= 9V. Then, we could calculate theoretical value for the Vx by using the nodal analysis. (9-Vx)/39+(9-Vx)/100=Vx/680, so the Vx=8.6433V. The second part was to calculate the Vy by connecting the two points. (Vs2-Vy)/Rc2+(Vs1-Vy)/Rc1=Vy/RL1+Vy/Rc3, the Vy=5.11V. Furthermore, we got the Isc=Vy/Rc3=0.131A  and Rth= 65.97ohms. If the ab point carried 8v; then, the resistor should be (8.64-8)/66=8/X, so the resistor X=825 ohms. I would be the same with Isc and V was the same with Vth=8.64 V. After we calculated all the theoretical values, we did set up the circuit like the image, and we almost got perfect numbers. We were used Rth=66.6 ohms and RL2=825 ohms and Vth=8.64V, all the numbers were real close to the nominal value. The value we measured were 7.98V for Vload 2 when RL2=RL2, min, the percentage error was 0.25%, and when RL2= infinity, the Vload 2=8.64 the measured value was 8.63V so the percentage error was 0.11%. I thought this experiment was perfect.

Sunday, March 27, 2011

Laboratory #5PSpice

This lab that we basically studied how to use the PSpice software to solve problems.
The first image which i did in the class is just what i followed by the handout of the pspice tutorial. The thing that what i learned is the software need to run as administrator, otherwise people would not find the running system.
The second image is the last problem from the homework. As the practice goes on, i noticed we always need to set up the ground first, and put the parts step by step. In addition, we need put more attention on the positive and negative sign. In a word, it is a great software to solving electronic circuit problems.

Tuesday, March 15, 2011

Laboratory #4 Nodal Analysis

Today, we just used the method of nodal analysis to figure out the voltage of each nodal and test it out the error. In another way, we also could use the voltage of each nodal to figure out the power supply.
First of this lab, we established two equation which were 0-V2/Rc1= V2-V1/Rc1+V2-V3/Rc2 and
V2-V3/Rc2=V3/RL2+V3-V4/Rc3. So we had V2=10.25V and V3=8.67V.
Furthermore, we got Ibat1=V1-V2/Rc1=0.0175A, and Ibat2=V4-V3/Rc3=0.0015A which these are the current of the battery. Because the power equal to the current times the voltage, so Pbat1=0.179375W, Pbat2=0.013005W.Then, we did the set up and use the actual equipment to do this experiment that we had Rc1=99.4ohms, Rc2=219ohms, Rc3=223ohms, RL1=995ohms, RL2=999ohms, Vbat1=12.11V and Vbat2=9.08V. We had been through a hard time to measure the value, and we got them all finally that they were Ibat1=17.8mA, Ibat2=1.53mA, V2=10.3V and V3=9.41V. Luckily, these numbers percent error were really small. They are 1.7%, 2%, 0.4% and 8.5%.
For doing the more calculation, the Pbat1= Vb1*Ib1= 12.11V*0.0178A=0.215558W and Pbat2=9.08V*0.00153A=0.013892W.
If the V2=V3=9V, the new set up will be -9V/1000=9-V1/100, and 9/1000+9-V4/220=0. The result will be V1=9.9V which is battery 1 and V4=10.98 which is battery 2.
After finishing this experiment, I learned a couple easy ways for measuring stuff. But i also get touch with a lot of mistake which could occur that makes the lab harder for doing the wrong way.